Recent Upgrades to Our Calculator
We recently made a number of upgrades to our homepage mortgage calculation tool.
Better JavaScript-Driven Charting Tools
For many years the chart on our site were powered by Flash. As popular as Flash once was, it caused many mobile browsers to crash. Steve Jobs shared his disdain for Flash in April of 2010.
Our initial solution to the support for Flash being limited to desktop devices was to not show charts to browsers which did not support Flash. We figured this to be a reasonable trade off because charts might take up too much space on smaller mobile devices.
In June Apple announced they would soon start blocking Flash on desktop devices as well.
Given how many home buyers use Apple devices we decided it made sense to upgrade our charts to shift away from Flash charts to JavaScript driven responsive charting. We found HighCharts to be the best solution for this implementation.
Here is what the old charts looked like

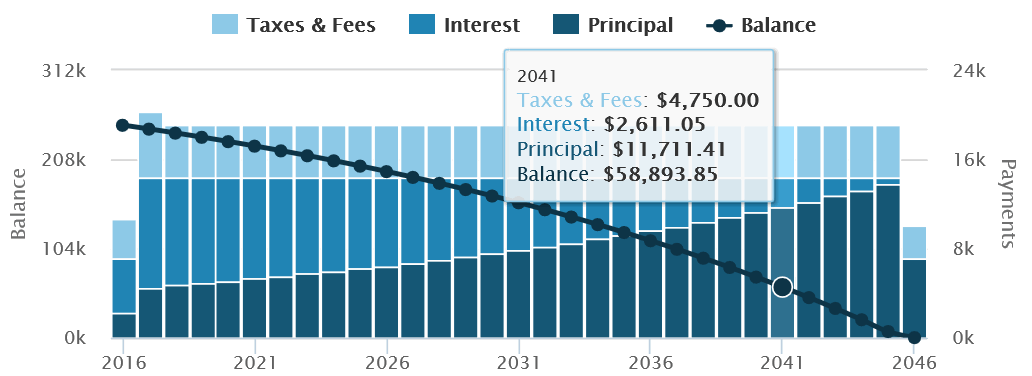
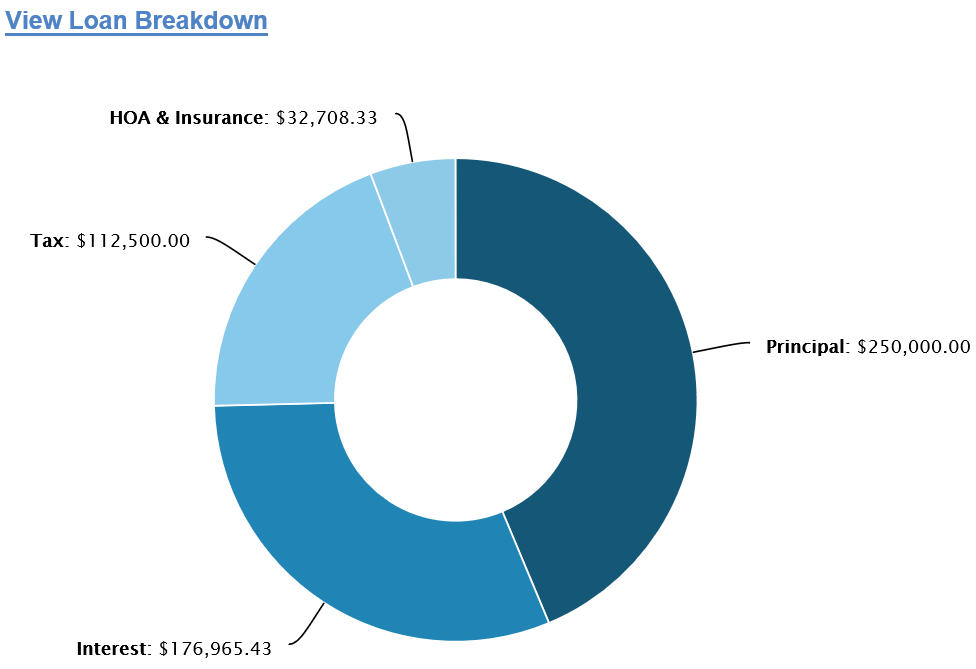
Now instead of there being 3 smaller graphs across the page, the remaining balance and annual payments are shown on a single wider graph & users can click the link below that to view a donut graph of payment breakdown by source. The top graph also contains tool tips so a user can see what portion of each year’s payments go to principal vs interest and so on.


Fewer Ads
Many publishers have responded to lower CPMs on mobile and the rise of ad blockers by adding more ad units, larger ad units & more invasive tracking to their pages.
Unblockable pop-ups, in-text ads, fly-in ads that move the text while you are trying to read it & auto-playing auto-generated video are just a few examples of the sort of stuff publishers are doing.
We have been approached by advertisers asking us to sell them a tracking pixel on the site…
I’m sure you’ve done this before, but I would specifically be asking to put a pixel on your website so that I could target your users other places on the internet outside of your website. I think the users of your site are similar to the users of my site, and the ability to target your users on other websites is something that I think could be valuable for my company.
Please know that I’m a serious ad buyer, and I spend 7 figures on advertising deals annually. If you would be open to me testing your users in this Retargeting trial, I would also be interested in buying ads directly on your site.
This test would be easy to set up, as I would just send a Google Retargeting Pixel to your webmaster who could implement it on the back-end. That’s it. I would then have the ability to target users of your website in other places and see if my ads resonate with them. I could be willing to pay you a monthly fee for this “pixel space.”
Thanks for your consideration!
…and we have universally refused these sorts of offers, as we view them as a violation of user trust. It is those sorts of backroom deals which have led to the rise of ad blockers.
We have taken a more sustainable user-friendly approach & reduced our ad load across the board. No page on our site has more than 2 ad units & the mobile version of our site only has a single ad unit.
Further, on the homepage and m. versions of our calculator users have the option of completely turning all ads off under the advanced settings menu which controls options like the display of amortization graphs.
Improvements to m. Version of Site
While both our regular homepage & the m. version of it use responsive web design features, on the m. version of the subdomain we also removed the ad unit which was near the calculation results so users can see the results faster on the small screen space mobile devices provide. We do not use any interstitial or anchor ads, to ensure the mobile experience is as fast and clean as possible.
We also disabled charts from appearing on the m. version, due to the constrained screen space, however a user can click the view desktop version of site to enable charting.
The m. version of the site still includes a mortgage rate table below the calculation results, so users can quickly see their current local market conditions, particularly in light of how BREXIT and other issues have rapidly moved US Treasury & mortgage rates.
Added Inputs for HOA & Home Insurance
Over the years we have had a number of requests to add the cost of insurance and HOA fees so buyers can see an “all-in” cost of ownership. We added these as input fields & made the calculation result output format more intuitive so people can quickly see their full monthly expenses while paying PMI & when PMI no longer required.
Perhaps the only major cost which our tool doesn’t currently account for is maintenance, but typically those expenses are lumpy and somewhat unpredictable. A good rule of thumb is 1% to 3% of the home purchase price, but this is a quite wide range & may be high for new homes while being low for older homes with major issues.
Further, mortgage interest deductions off income tax likely offset the maintenance costs for many home owners. There is always a trade off between the complexity of features in a tool & the usability of it. One way we offset some of these sorts of issues is for an input field like HOA we default it to zero & then on the results display we do not show HOA information if it is zero. Likewise if PMI payments are not required we do not show PMI info in the results.
Share This Calculation Result
Home purchases are typically the largest single investment most consumers make in their lifetime. Given this & the shift toward using mobile devices, we thought it made sense to make it easier for people to share calculation results.
On each calculation we create a short link which can be shared across the web or via mobile messaging applications.

This feature will help improve communications between partners (while someone is stuck at work, or such) & it will help agents sell more homes by making it easier for them to help their clients quickly see what is & is not affordable at a glance without any risks of miscommunications.
Features We Are Currently Thinking About
While we already have other calculators on our site which make it easy to compare the costs & benefits of refinancing, compare different loan term lengths side-by-side, print out an amortization table & help users see the impact of extra payments, we will soon modify the homepage of our site to make the CSS print feature easier to use to print out the amortization tables it creates. Updated: we now have the printer-friendly version of the homepage live, and users can share this version of their calculation with other people just like the short-URL version of the homepage.
We are evaluating adding other options, but want to be careful not to ruin the flow of the homepage calculator. We may also test surfacing some of the other calculation tools on the homepage in areas other than the sidewide navigation, but will be careful not to cloud the clean user experience of the homepage.
Thanks for reading this and using our website!
Have any feedback on features you would like to see? Please share your comments below.
El Monte Homeowners May Want to Refinance While Rates Are Low
US 10-year Treasury rates have recently fallen to all-time record lows due to the spread of coronavirus driving a risk off sentiment, with other financial rates falling in tandem. Homeowners who buy or refinance at today's low rates may benefit from recent rate volatility.
The following table shows current 30-year mortgage refinance rates available in El Monte. You can use the menus to select other loan durations, alter the loan amount. or change your location.
Leave a Reply

Free Mortgage Calculator for Your Website!
Would your customers benefit from a free mortgage calculator on your website? Learn how to add a calculator to your website in less than a minute - FREE!


